A Tour of the ThreatStream Overview Dashboard
The Overview dashboard is your hub for proactive threat detection on ThreatStream. It displays summaries of the latest threat intelligence available to you on ThreatStream, recent activity within your organization, alerts that require your attention, and notifications for open tasks assigned to you.
Each user is free to customize the appearance of their dashboard. In addition to selecting the widgets displayed on your dashboard, you can drag and drop widgets to change the order in which they are arranged.
Below is the example of the Overview dashboard.
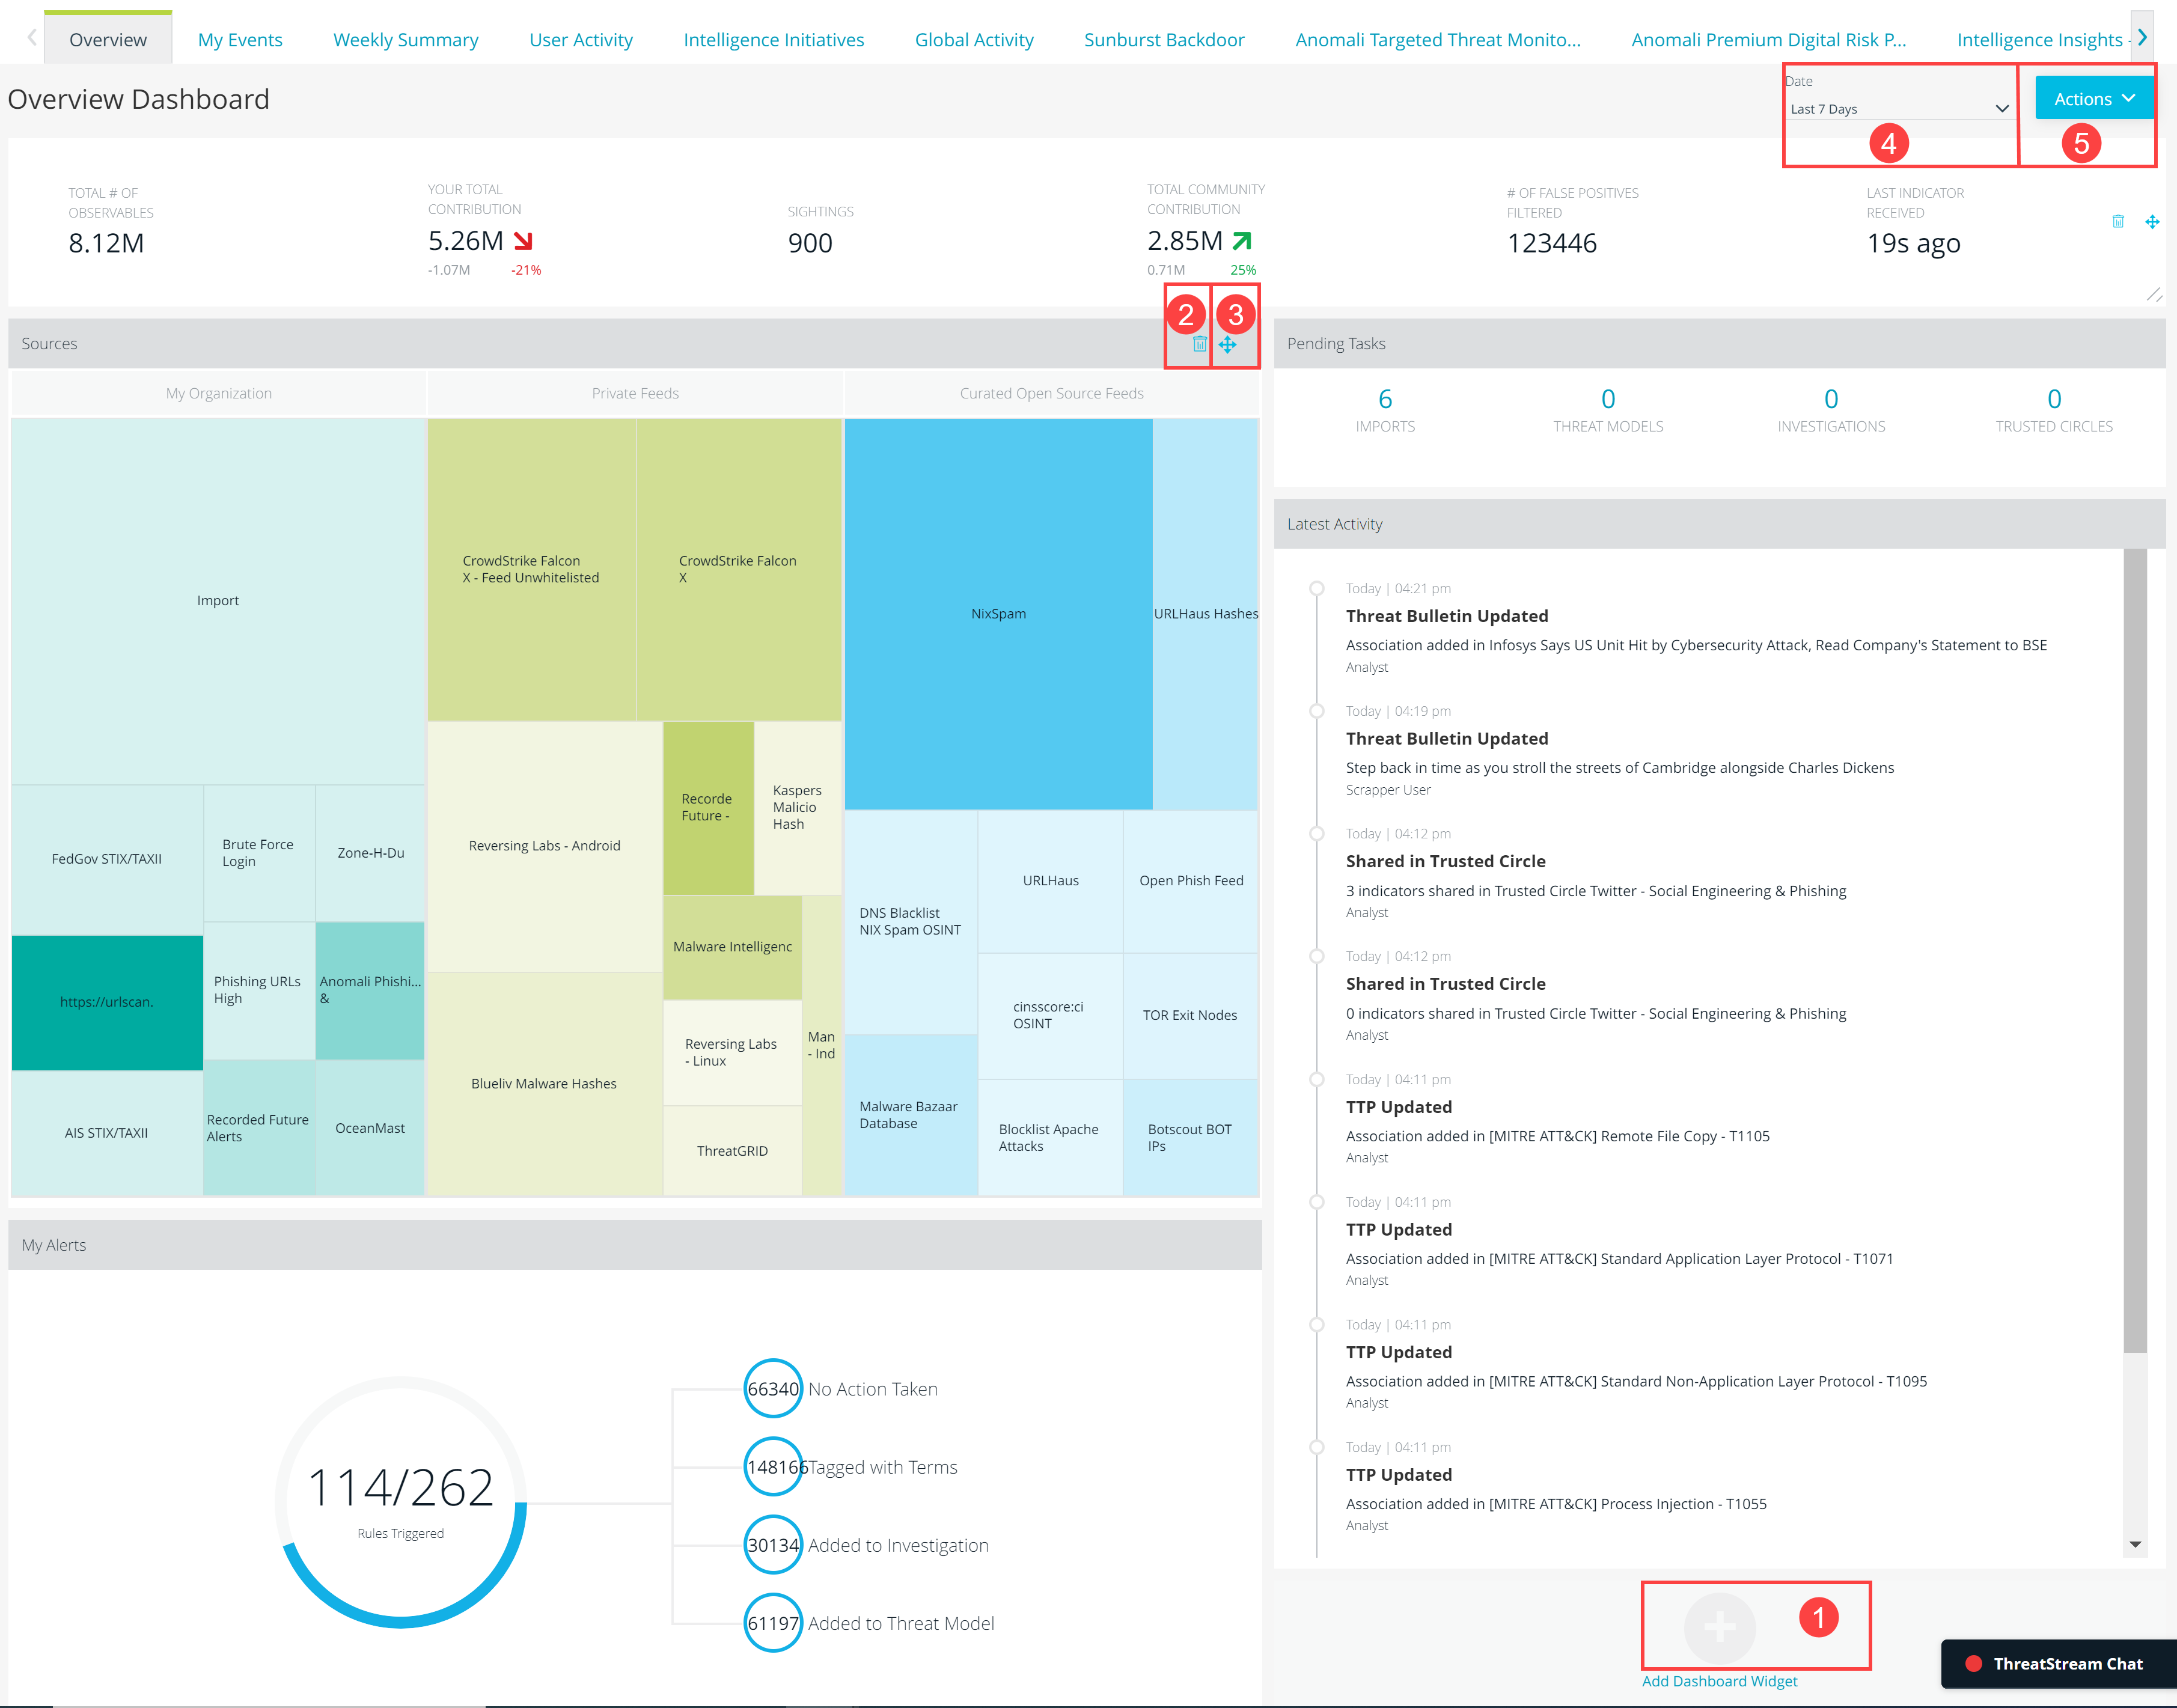
 Click Add Dashboard Widget to select additional widgets to display on your dashboard.
 Remove the widget from your dashboard.
 Change the location of the widget on your dashboard. Click and drag the widget to the desired location.
 Select a date range for the data displayed on the dashboard. By default, data from the last seven days is displayed.
 Reset your dashboard to the default configuration.
Available Dashboard Widgets
The following table contains an alphabetical list of all available widgets. Once you add a widget, it is no longer available in the Add New Dashboard Widget drop-down list. Therefore, your drop-down list will only contain widgets that are not yet added to your dashboard.
| Widget | Description |
|---|---|
| Contributions |
View a summary of recent intelligence contributed to ThreatStream. Note that this is the top-most horizontal box at the top, which spans across the entire dashboard.
|
| Indicators by Type |
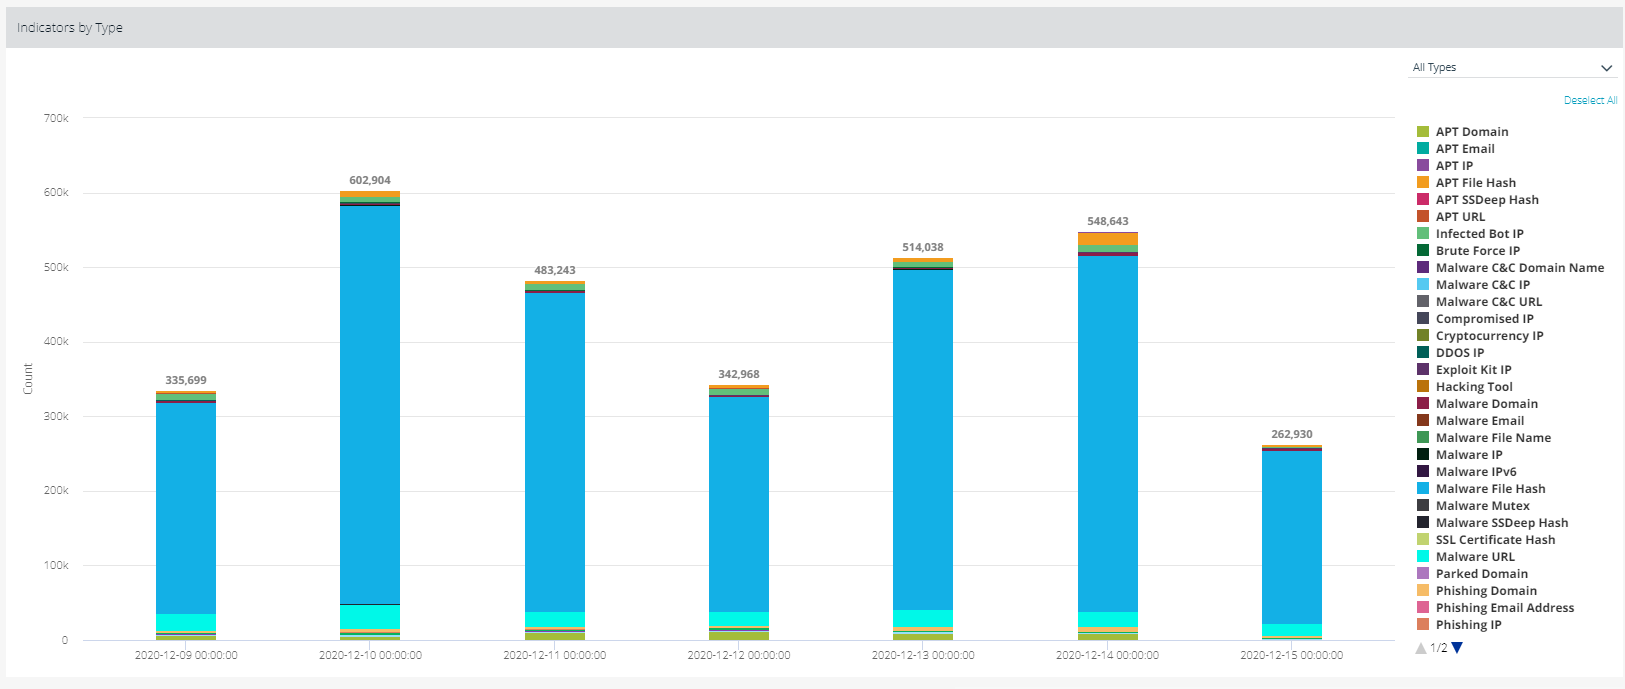
View observables added to ThreatStream by indicator type on a bar chart. Click bar chart segments to view observables on the Observables search page.
Use the top right menu to toggle between a view of All Types, Top 5 Indicator Types, and Top 10 Indicator Types. Indicator types represented on the chart are listed in the chart key. You can click indicator types on the chart key to add or remove them from the chart. Click Deselect All to remove all indicator types from the chart, or Select All to add all indicator types from the chart key to the chart. |
| Sources |
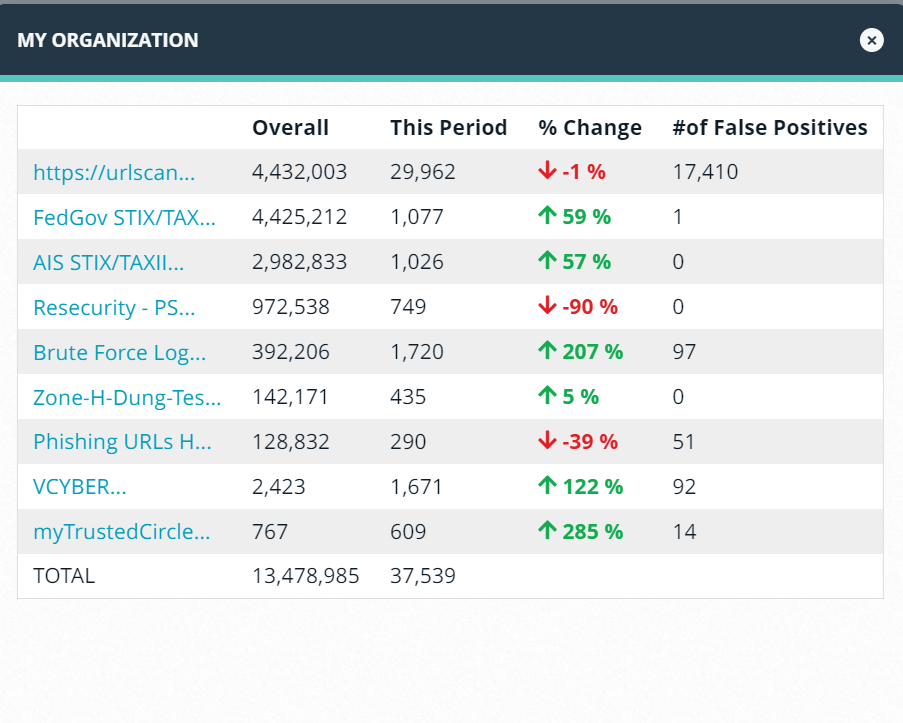
View statistics on observables added to ThreatStream via your organization, private feeds, and curated open source feeds. You can click the columns to view the top 10 sources in each category, as displayed below.
Note: The count in the Overall column of the My Organization widget includes all observables available to the organization. For the Import source, the count includes all manual imports from your own organization and the ones in your community (manually imported observables from other ThreatStream users that your organization can see).
|
| Investigations |
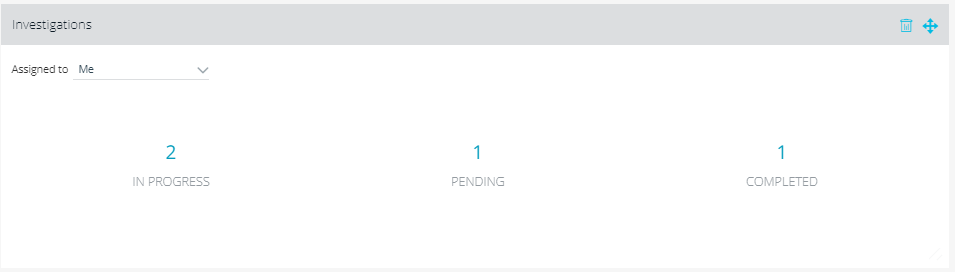
View investigations assigned to you or a workgroup to which you belong by status. You can filter investigations by assignee by using the Assigned to filter.
To drill into investigations of a status, click the status count. Investigations are listed on the Investigations list view screen. See Investigations List View for more information. |
| Investigation Task List |
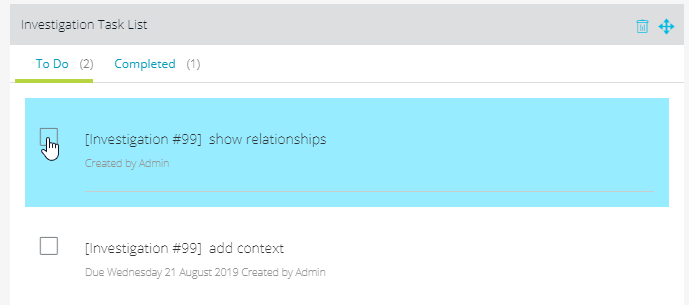
View open and completed investigation tasks which have been assigned to you. The To Do tab lists tasks which you have yet to complete. Completed tasks are listed on the Completed tab.
You can mark an open task as complete by checking its box on the To Do tab. When you mark a task complete, it is moved to the Completed tab. Similarly, you can uncheck tasks on the Completed tab to reopen and move them back to the To Do tab. You can click tasks to visit the relevant investigation. |
| Latest Activity |
View the 10 most recent notifications on ThreatStream activity. Notifications are displayed when:
|
| Latest Rule Matches | View matches for keywords in recent intelligence configured by your organization in Rules. Click the Details link to drill down on the matched intelligence. For more on Rules, see Rules. |
| My Alerts |
View statistics on recently triggered rules and corresponding automated actions taken by ThreatStream.
You can click any of the rule categories to view a list of triggered rules in a pop up window. |
| My Recent Attacks |
View observables that triggered alerts in integrated destinations such as ArcSight ESM, Splunk, and Security Analytics. Count shows the number of times observables have been seen in ThreatStream. Click the Observable to drill down for deeper analysis on the observable details page. Data must be provided to ThreatStream in a My Attacks Report in order to populate the My Recent Attacks widget. See My Attacks Report for more information. You can view My Recent Attacks data in the My Attacks widget on observable details pages. For more on My Attacks, see Viewing Matches and My Attacks. |
| Organization Recent Sandbox Submissions | View recent submissions to your Sandbox. Org Admins can click the Status to review and approve submissions. |
| Pending Tasks |
View open tasks which have been specifically assigned to you or available for you to complete based on your user privileges. Tasks include reviewing import sessions, reviewing threat model entities, triaging investigations that are in pending state, and approving requests to join your trusted circles. Click the task type to drill down on open tasks.
|
| Streams by Confidence and Severity |
View streams feeding your threat intelligence in ThreatStream by the Confidence and Severity scores of the observables they provide. The quantity of intelligence is represented by the size of each circle. You can hover over a stream for the name of the stream, average Confidence score, average Severity score, iTypes provided by the stream, and the number of observables provided by the stream. |
| Threat Model Entities |
View the most recently published threat model entities to which you have access on ThreatStream. Click See more threat models to view expanded results on the Threat Model List View. |
| Top ASNs | View the most widely seen ASNs associated with recent observables in ThreatStream. |
| Top Impacts | View the most widely seen indicator types associated with recent observables in ThreatStream. |
| Top Threats by Country | View the most widely seen geographical source of recent observables in ThreatStream. |